A labelling system audit is the foundation of any transformation project. This assessment captures your current state. This article covers templates, printers, workflows and risk areas, so you have the data to inform design decisions and migration priorities.
First, define which locations, production lines and departments are in scope.
Include warehouses, packaging areas, shipping docks and returns processing. Create an audit team with clear responsibilities: an audit lead who coordinates the discovery, IT staff who provide system access and run scripts, template owners who explain the business context and site contacts who know the local printer setup.
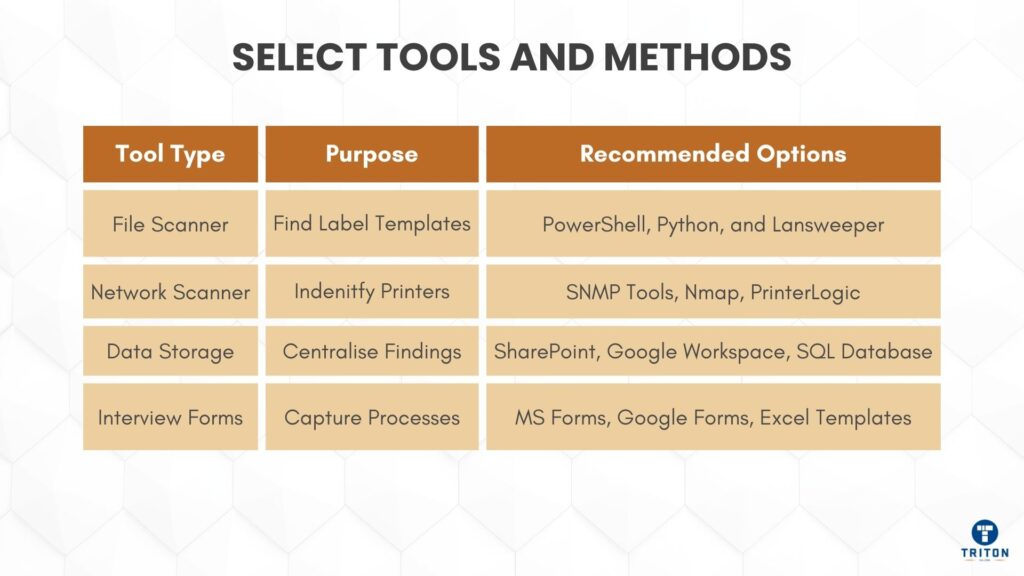
Prepare file scanning scripts to search network drives for label templates. PowerShell works for Windows environments, Python for mixed operating systems. Use network scanning to find connected printers.
Create standardised questionnaires for warehouse operators, production supervisors, quality staff, and IT technicians who work with labels daily. These interviews reveal undocumented workarounds and local template files that automated scans miss. Store all findings in a central database or spreadsheet.
Brief department heads before you start. Explain what access you need, how long the discovery will take and what disruption to expect. Get written approval for system access. Schedule audit activities around production schedules to maintain goodwill and get accurate volume measurements.
Run automated scans across all file servers, shared drives and backup locations. Search for label file extensions (like .btw, .zpl, .xml, .lbl) and proprietary formats.
Scan user desktops, email archives and departmental folders as local copies often have unauthorised modifications.
Record these attributes for each file. Record full file path, file size, creation date, last modified date and number of copies found. When you see multiple copies, note all locations and compare versions for differences.
Interview operators and technical staff directly.
Ask: “Do you maintain any label files locally?” and “Have you created workarounds when the main system fails?”
Users often create Excel macros, Access databases or Python scripts that directly generate labels. Document who maintains each shadow solution, which labels it produces, how it usually runs and why it exists.
Check if templates use version control. Look for version numbers in file names, change history documentation and approval signatures. Templates without version control are at a higher risk. Document naming conventions.
Consistent naming speeds up discovery and reduces errors.
Create a complete printer registry with these fields:
Field | Details to Capture |
|---|---|
Manufacturer & Model | E.g. Zebra ZT421, TSC DA |
Serial Number | Unique device identifier |
Firmware Version | Current installed version |
Location | Building, floor, department, line |
Network Type | Ethernet, USB, serial, wireless |
IP Address | For networked printers |
Print Volume | Labels per day/week |
Document the complete software stack for each printer: record driver versions, connection type (USB, network, serial) and print server details.
Capture printer settings including print darkness, speed and head pressure – these took years to optimise and must be preserved.
List media specifications: label dimensions, material, adhesive, and sensor method. For thermal transfer printers, document ribbon types. Include current stock levels and supplier lead times for special materials.
Document how labels print. ERP integration uses middleware or direct API calls to record the method, data format, and error handling – file drop systems export to watched folders and note paths, formats, and polling intervals. Manual printing varies from direct data entry to database selection, document access rights and frequency. Scheduled batch jobs depend on prerequisites – map these dependencies.
Select five representative label types. Trace each from the data source to the printed output. Identify the originating system, document data extraction and transformation, map the path to the printer and note quality checks. Create flow diagrams showing standard and exception paths.
Mark where humans interact: data verification, template selection, reprint decisions and quality inspection. These touchpoints introduce errors and slow throughput, becoming primary automation targets.
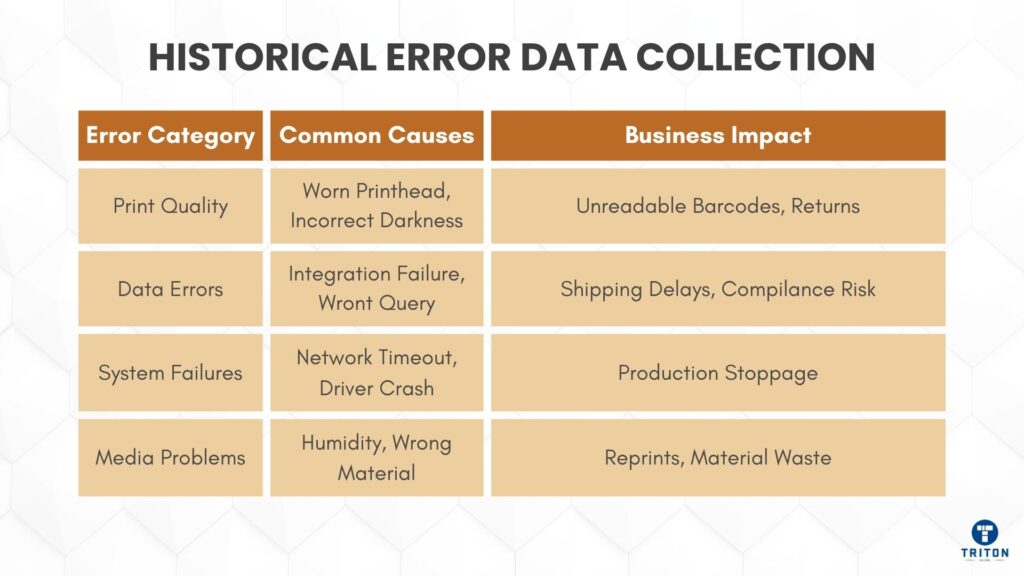
Gather six months of labelling issues from help desk tickets, quality logs and incident reports. Categorise errors: print quality (faded, misaligned), data errors (wrong information, missing fields), system failures (printer offline, network issues), media problems (jams, adhesive failure).
Calculate waste metrics: reprints per day, percentage of labels scrapped, time lost to issues and material costs. One manufacturer discovered 8% reprint rates costing £45,000 annually in materials alone.
Identify which printers fail most often, which templates cause errors, when issues occur and who reports problems. Create heat maps to focus migration efforts.
Create a spreadsheet with these columns: Label ID, business purpose, template filename and location, printers used, trigger mechanism, daily volume, error rate, business priority (high/medium/low), and migration complexity (easy/medium/hard).
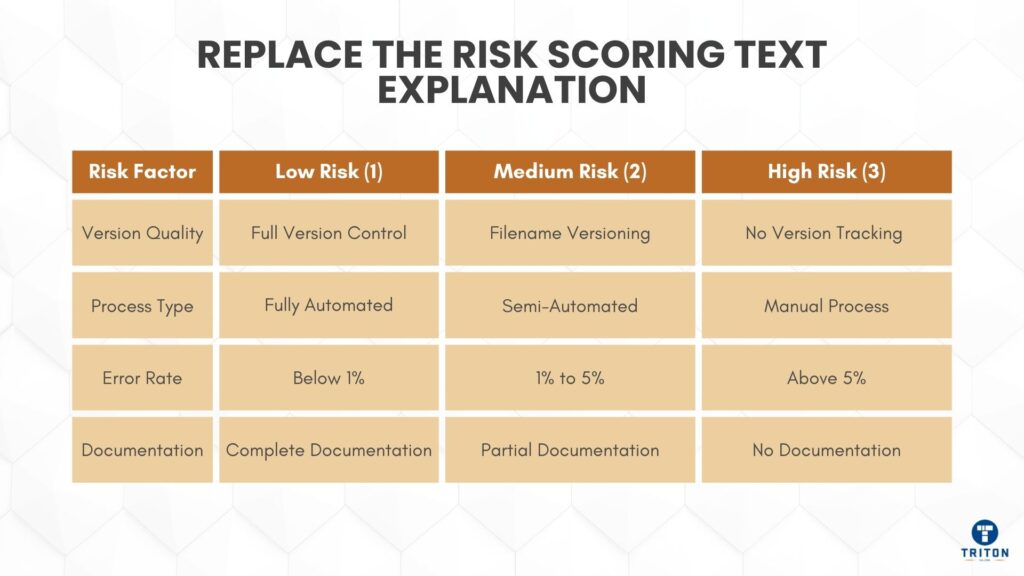
Score templates on version control, process automation and error frequency. High 3, medium 2, low 1. Sum scores and sort by total to determine migration order.
Document dependencies between templates, systems and processes. Which templates require which printers, which systems must run first and which processes need approval? These affect migration order.
Print servers (OS, specs, load), network topology, database servers, application servers. Bandwidth between sites and latency measurements. Custom configurations and environment variables.
Cross-reference printer inventory with asset register. Compare template counts with production reports. Validate workflow maps through observation. Check error logs against help desk tickets.
Test prints for critical labels. Typical and edge cases. Introduce controlled failures to test error handling – document as acceptance criteria for the new system.
Two-page summary: inventory found, key risks in business terms, opportunities with estimates. Unauthorised label changes risk regulatory breaches; current error rates delay shipments daily – phased approach with resource requirements.
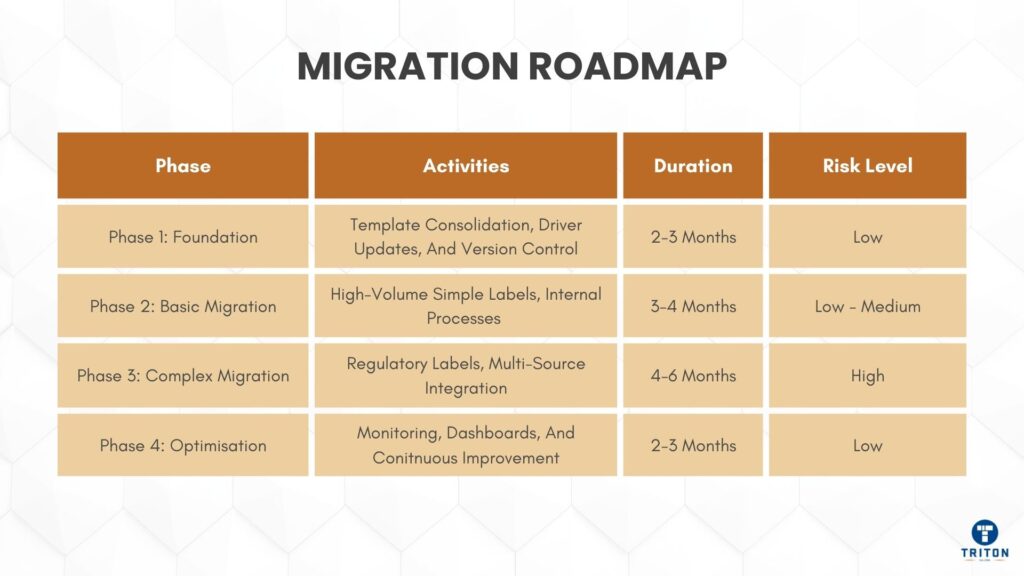
Asset inventories, risk assessments, workflow documentation, and infrastructure diagrams. Master mapping matrix with views for different audiences. Data is searchable and filterable. Phase 2 moves high-volume, low-risk labels to test the system with minimal disruption. Start with internal labels before customer-facing ones.
Allow 3-4 months for testing.
Phase 3 addresses complex integrations and high-risk templates that require careful coordination. Regulatory labels need quality validation. Multi-source labels need extensive testing. Allow 4-6 months for testing and approvals.
Phase 4 implements monitoring and continuous improvement. Add real-time error detection, performance dashboards and regular review cycles. Establish change control procedures that balance security with flexibility.
Present findings in business terms. Template consolidation reduces training. Printer standardisation simplifies spares. Workflow automation reduces overtime. Address disruption, training and costs using audit data as evidence. Get formal approval with specific deliverables, timelines and governance.
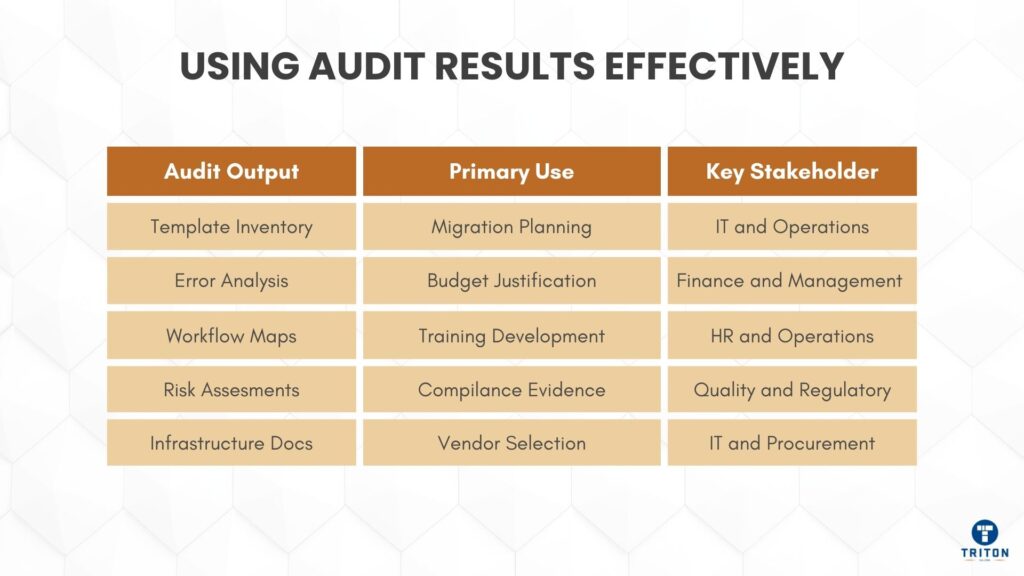
Share actual volumes and complexity metrics with vendors for accurate proposals. Calculate costs from material waste, manual processes and delays to justify budgets. Most transformations pay back within 18 months.
Create training plans based on shadow IT findings and error patterns. Users of Excel-based labels need alternatives. Repeated errors indicate training gaps. Power users become training champions.
Keep audit documentation for compliance evidence. Auditors like documented inventories, risk assessments and control procedures to show due diligence.
Update audit data annually to track progress. Compare error rates before and after migration. Monitor template proliferation and printer deployments. Regular updates prevent the degradation that required the original audit.
This structured approach is the foundation for success. The data you collect drives decisions and ensures your new labelling system meets actual needs, not assumed needs.
For professional-grade label printers, print servers, consumables, and labelling systems that streamline audits and reduce compliance risk, visit Triton Store.